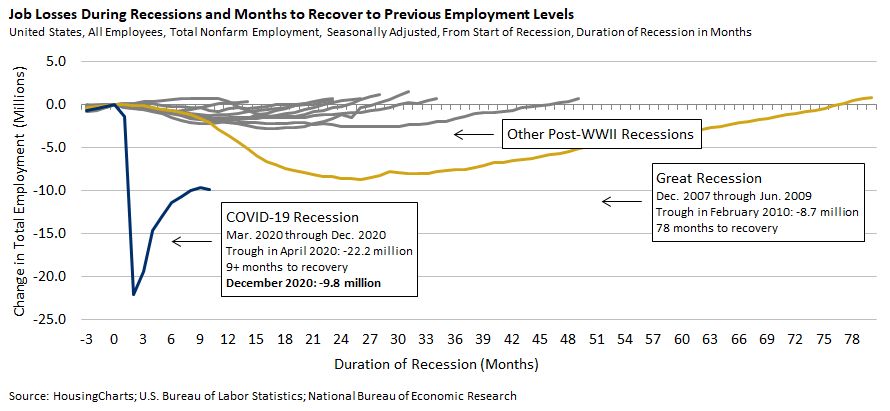
“In 2020, the economy shed a net 9.37 million jobs, exceeding the 5.05 million jobs lost in 2009, in the aftermath of the global financial crisis. Hardest hit last year were hotels, restaurants and related industries, driving up unemployment among minorities, the young and less educated workers—groups already disproportionately hit by the economic effects of the coronavirus. Unemployment among Black and Hispanic workers has significantly exceeded the national average throughout the pandemic.” – The WSJ
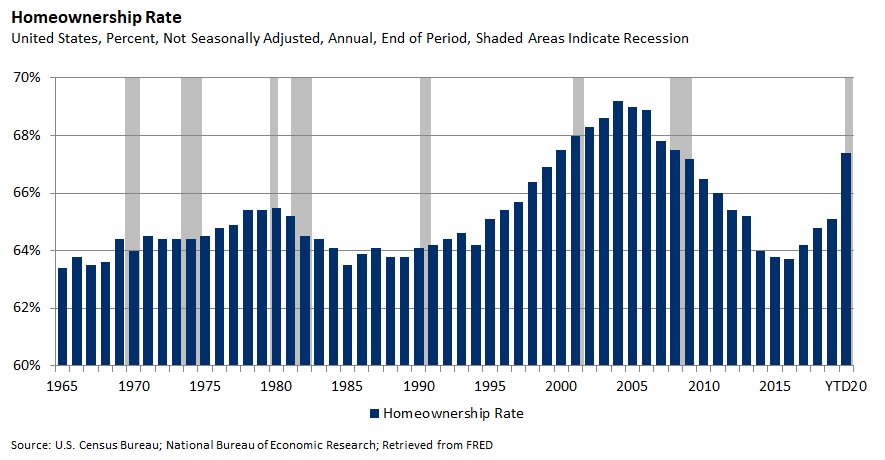
The homeownership rate of 67.4% was higher than the rate in third quarter 2019 (64.8%) and not statistically different from the rate in second quarter 2020 (67.9%). Data collection operations were affected by the COVID-19 pandemic, as in-person interviews were only allowed for portions of the sample. The extent to which data collection changes affected estimates was not determined.
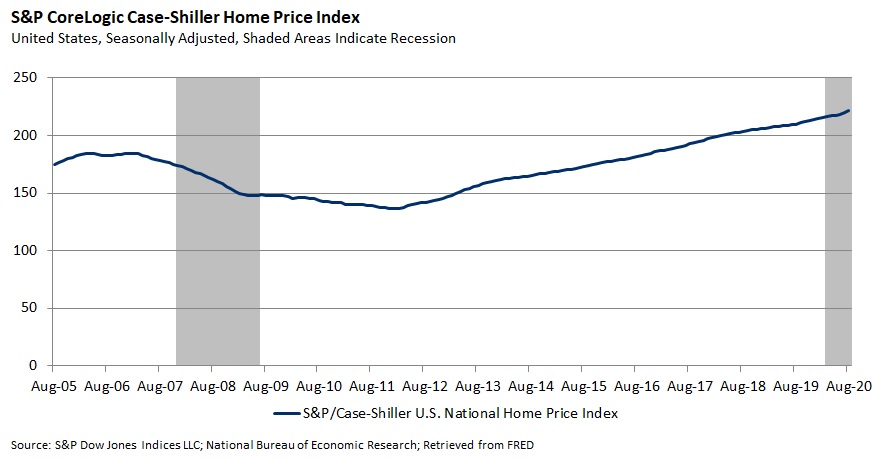
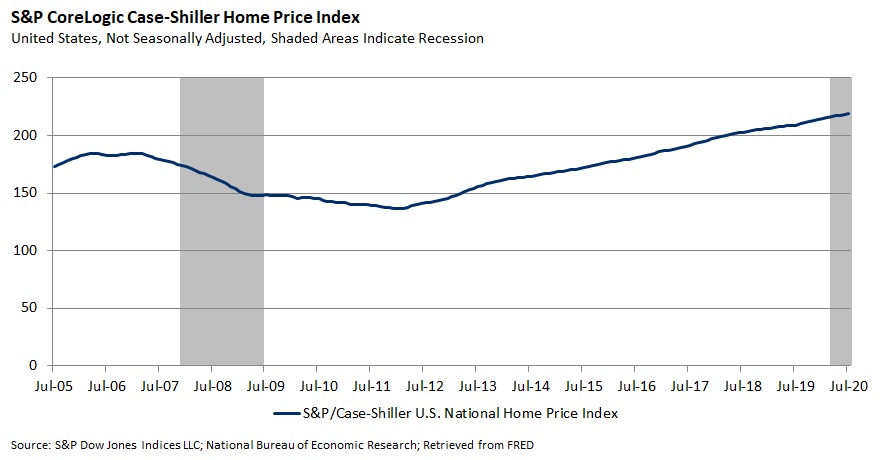
Phoenix, Seattle and San Diego reported the highest year-over-year gains among the 19 cities (excluding Detroit) in August. Phoenix led the way with a 9.9% year-over-year price increase, followed by Seattle with an 8.5% increase and San Diego with a 7.6% increase. All 19 cities reported higher price increases in the year ending August 2020 versus the year ending July. (S&P Dow Jones Indices )
Privately-owned housing units authorized by building permits in September were at a seasonally adjusted annual rate of 1,553,000.
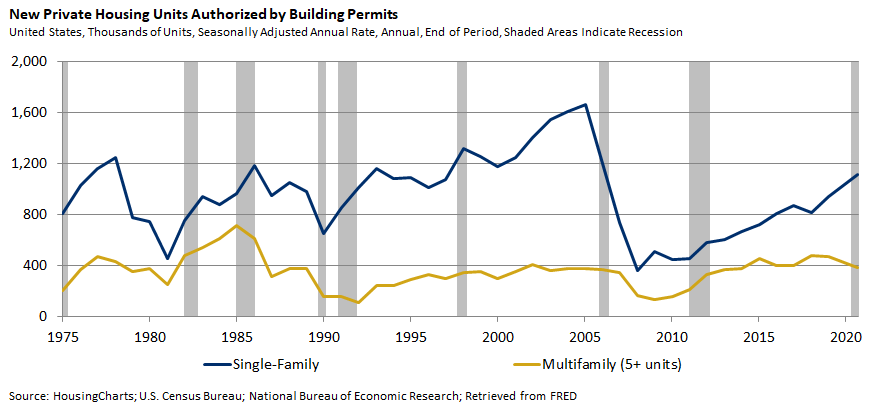
Privately-owned housing units authorized by building permits in September were at a seasonally adjusted annual rate of 1,553,000. This is 5.2% above the revised August rate of 1,476,000 and is 8.1% above the September 2019 rate of 1,437,000. Single-family authorizations in September were at a rate of 1,119,000; this is 7.8% above the revised August figure of 1,038,000. Authorizations of units in buildings with five units or more were at a rate of 390,000 in September. (U.S. Census Bureau)
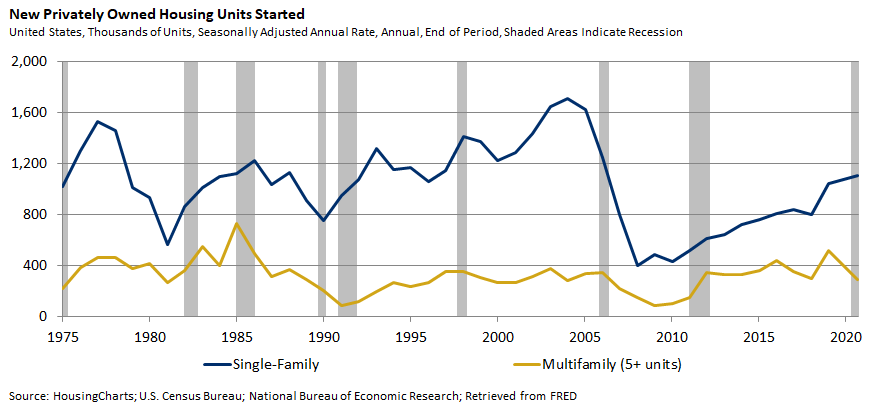
Privately-owned housing starts in September were at a seasonally adjusted annual rate of 1,415,000.
Privately-owned housing starts in September were at a seasonally adjusted annual rate of 1,415,000. This is 1.9% above the revised August estimate of 1,388,000 and is 11.1% above the September 2019 rate of 1,274,000. Single-family housing starts in September were at a rate of 1,108,000; this is 8.5% above the revised August figure of 1,021,000. The September rate for units in buildings with five units or more was 295,000. (U.S. Census Bureau)
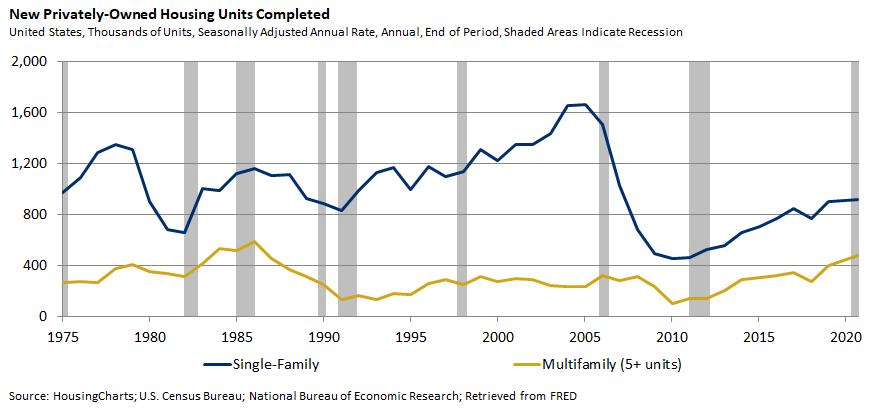
Privately-owned housing completions in September were at a seasonally adjusted annual rate of 1,413,000.
Privately-owned housing completions in September were at a seasonally adjusted annual rate of 1,413,000. This is 15.3% above the revised August estimate of 1,226,000 and is 25.8% above the September 2019 rate of 1,123,000. Single-family housing completions in September were at a rate of 921,000; this is 2.1% above the revised August rate of 902,000. The September rate for units in buildings with five units or more was 480,000. (U.S. Census Bureau)
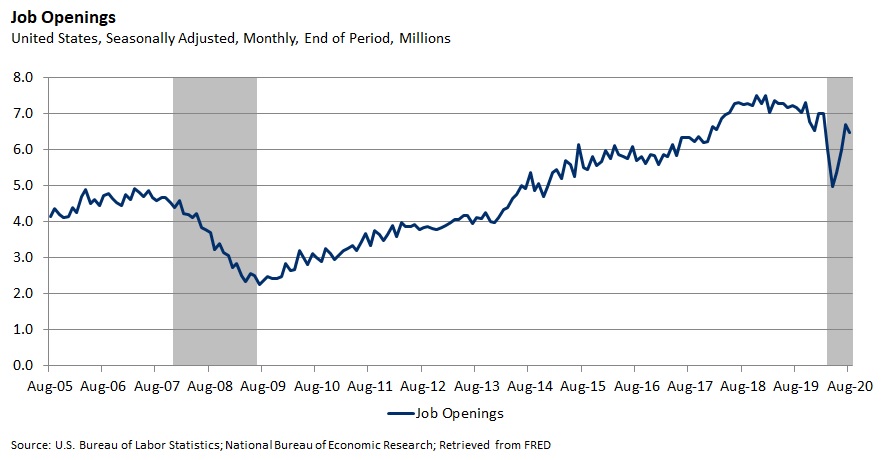
“The number of available positions slipped to 6.49 million during the month from an upwardly revised 6.7 million in July. A Bloomberg survey of economists called for a decrease to 6.5 million. Separations, which include layoffs and quits, dipped to 4.59 million in August, reflecting decreases in the number of job cuts as well as people voluntarily leaving their jobs.” – Bloomberg
“Standard & Poor’s said Tuesday that its S&P CoreLogic Case-Shiller national home price index posted a 4.8% annual gain in July, up from 4.3% in June. The 20-City Composite posted a 3.9% annual gain, up from 3.5% the previous month — beating analysts’ expectations of 3.6%, according to Bloomberg.” – Yahoo Finance
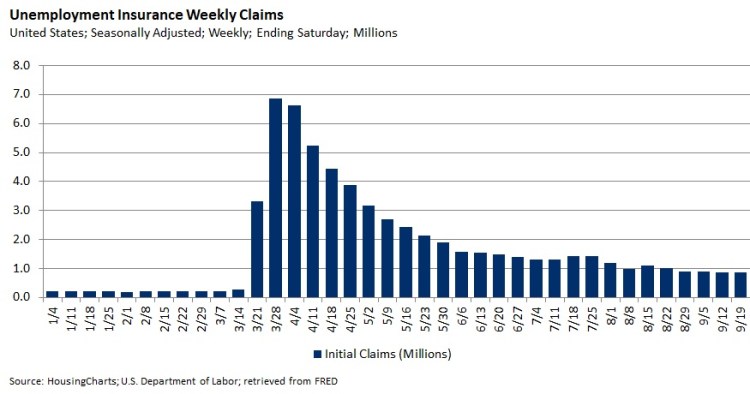
“Initial joblessclaims in regular state programs increased by 4,000 to 870,000 in the week ended Sept. 19. Continuing claims — the total number of Americans claiming ongoing unemployment assistance in those programs — declined 167,000 to 12.6 million in the week ended Sept. 12, which coincides with the reference period for the government’s monthly jobs report.” – Bloomberg